Prepared by FJA TV / CHRIS HARTLEY MEDIA V4. Key Facts. 7th January 2019
OVERVIEW
The 17th year of continuous TV coverage of what many within the sport and media now regard as the UK’s most successful motorsport series, The Funcup Championship has again produced some excellent edge of the seat racing and spectacular coverage. Presentation, programme content and overall production have again been to the highest standard with coverage provided by Frank Johns Associates and Chris Hartley Media.
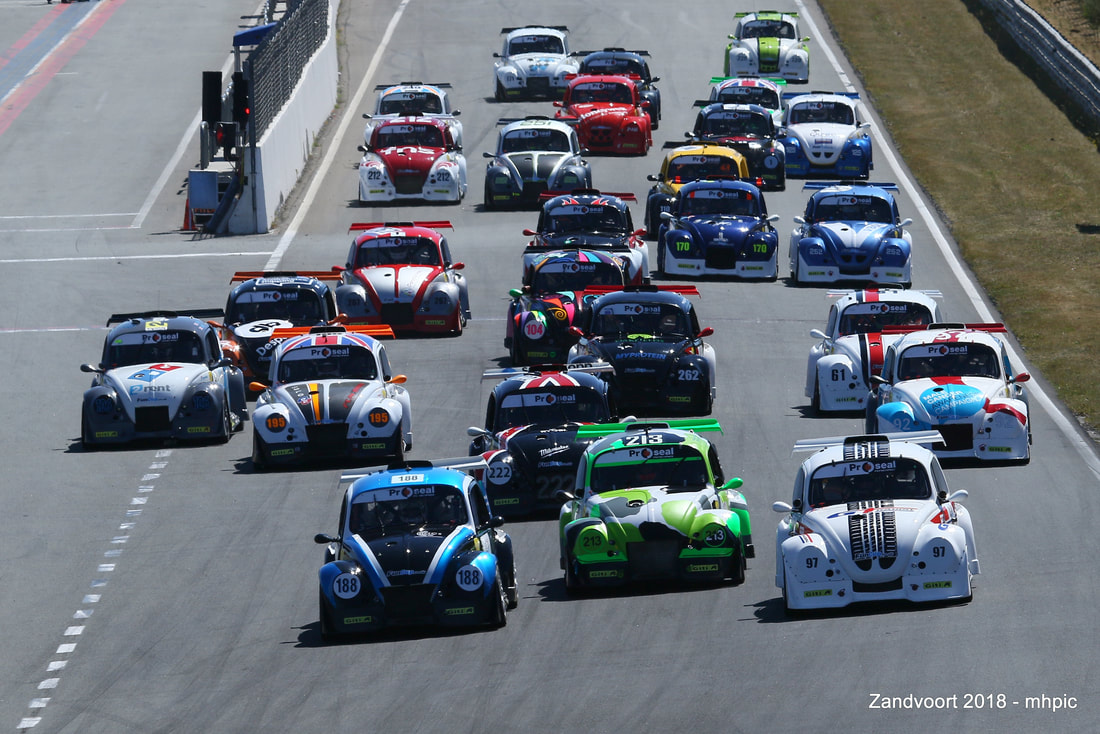
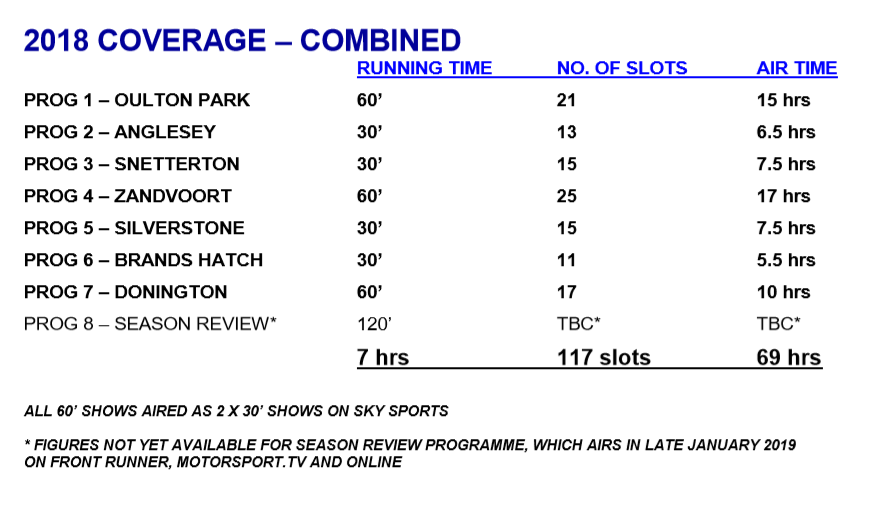
The schedule of coverage for 2018 was again challenging with the inclusion of three one-hour programmes and the replacement of the traditional Spa 25 Hours event with a newly created two-race endurance event at the famous Zandvoort circuit in Holland.
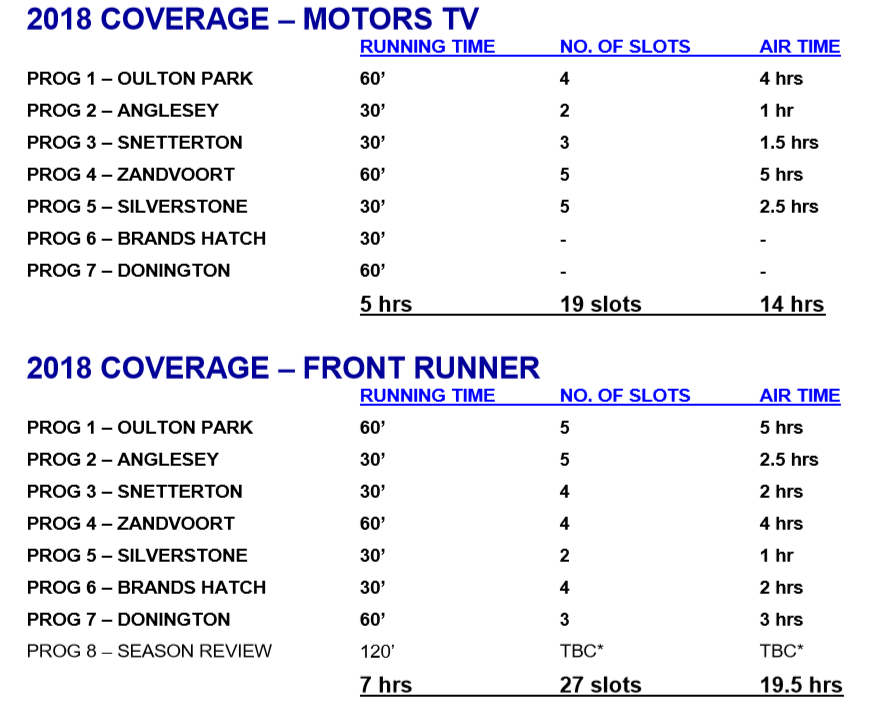
Coverage of each round of the championship followed the same successful formula introduced last year with the season’s opening round at Oulton Park providing one-hour coverage that allowed us to introduce the championship, its teams and a focus upon the newcomers to the Funcup. Rounds 2 & 3 were broadcast as a 30-minute report providing coverage of the Anglesey event that also included a night race. Round 4 saw us return to Snetterton again for a 30-minute programme followed by the Round 5 & 6 double header from Zandvoort.
As with the previous years’ championship, it all came down to the wire for the final one-hour programme Round 9 from Donington Park. With some 4 teams in contention, the 2018 championship was wide open and - as can now be expected from the Funcup - the drama started before the race even started with the demise of one of the leading contenders. The final race did not disappoint. The fortunes of those in contention altered constantly throughout what was an epic four-hour dual with the race leader running out of fuel within yards of the finish handing the championship to one of the years’ most consistent teams, whom at that point, had not one a single race throughout this hard-fought championship. Yet again Round 9 – the championship finale - proved to be a true summation of what the Funcup is all about.
Broadcast coverage has again been challenging. With last year being somewhat exceptional in terms of the number of programmes transmitted and hours of coverage achieved and the late season loss of one of our long-standing broadcasters, Motorsport TV, it was inevitable that we'd be unable to match the 2017 figures. During 2017 there was a unique spike in the 2017 figures – due in part to a hole in one of our broadcasters, Front Runner’s schedules and in part as an apology for some technical issues they had suffered with the Brands Hatch show - provided no fewer 23 slots for the Oulton Park programme in June and July. This alone accounted for some 11.5 hours of television representing some 10% of that year’s total number of TV hours slots. Without this spike, the 2018 figures would have come incredibly close to matching the record stats that we achieved in 2017. It was all great bonus coverage, but something that very rarely happens – with any broadcaster and any programme - and can skew overall year-on-year comparisons if not properly taken into account.
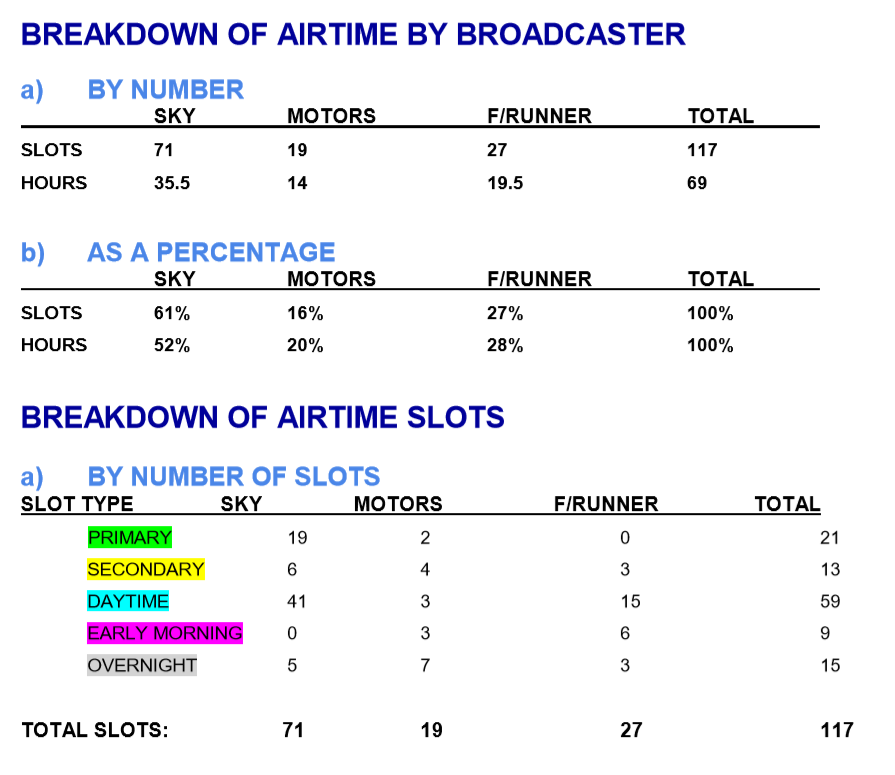
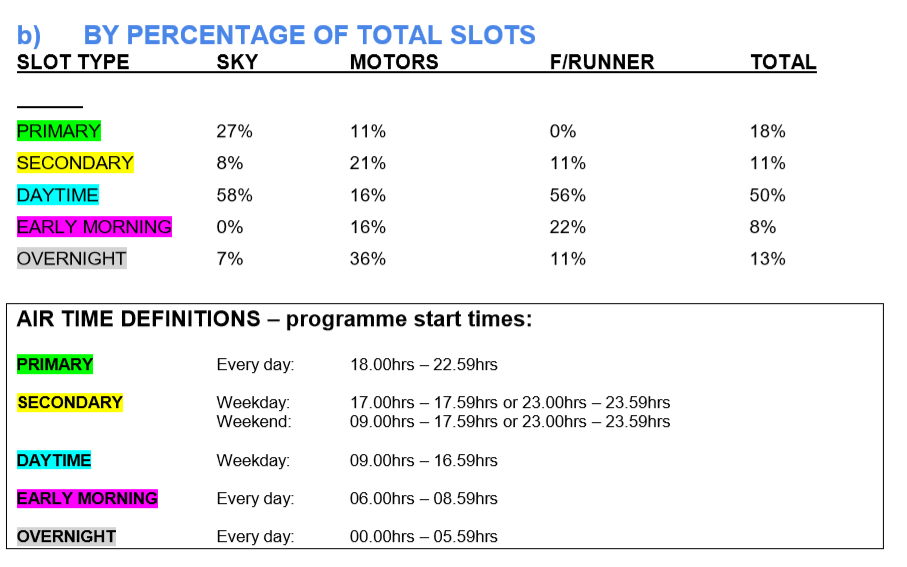
Nonetheless, our view is that the 2018 stats still make for brilliant reading and represent our second-best performance ever. Yet again we have succeeded in maintaining an excellent ratio of Prime and Secondary slots and the performance of the new broadcasters introduced in 2017 continues to impress.
On reviewing all the published data, we are pleased to report that audience viewing has held up well throughout the season. In producing this report, we used the industry’s recognised and trusted source of audience viewing data BARB (British Audience Research Board) to compile our data which now reflects actual audience viewing during the periods when the Funcup programmes were on air.
Programme 1 - Oulton Park
Skysports Arena: May (16th-25th): For the period in May that we were on air the total UK Viewing Audience averaged 41.7 million of which average daily reach achieved by this channel was 181 (000) and average weekly reach amounted to 792 (000).
Skysports Action: May (16th-25th): For the period during May that we were on air the total UK Viewing Audience averaged 41.7 million of which average daily reach achieved by this channel was 177(000) and average weekly reach amounted to 961(000).
Skysports Mix: May(16th-25th): For the period during May that we were on air the total UK Viewing Audience averaged 41.7 million of which average daily reach achieved by this channel was 277(000) and average weekly reach amounted to 1308 (000).
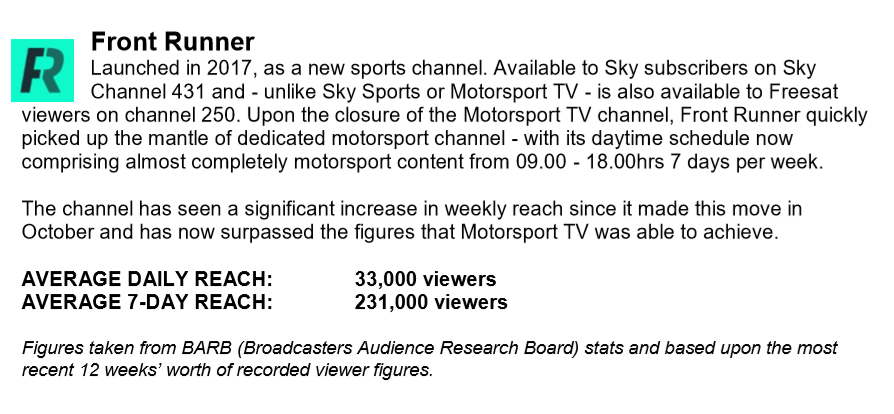
Front Runner: May(16th-20th): For the period during May that we were on air the total UK Viewing Audience averaged 41.7 million of which average daily reach achieved by this channel was 31(000) and average weekly reach amounted to 93.3(000).
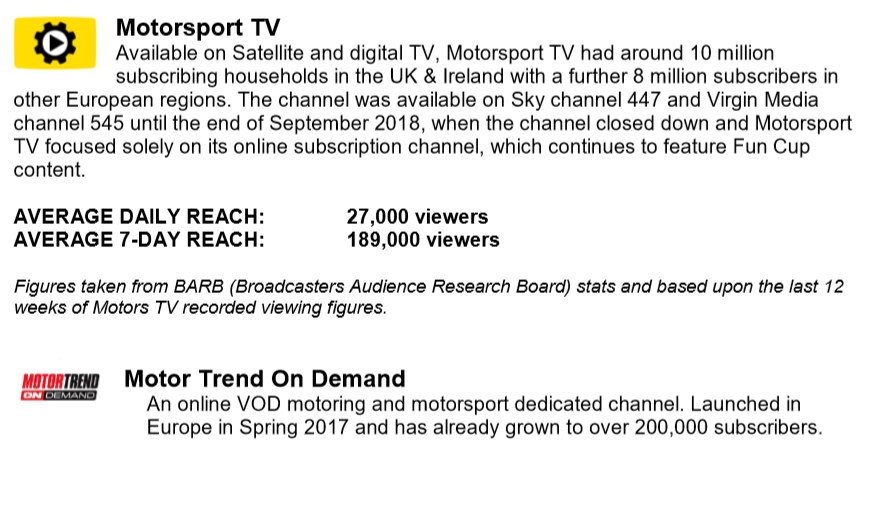
Motors TV: May(9th-13th): No figures published. (Average weekly total: 3.15 million)
Programme 2 - Anglesey
Skysports Arena: June(13th-15th): For the period during June that we were on air the total UK Viewing Audience averaged 42.6 million of which average daily reach achieved by this channel was 122(000) and average weekly reach amounted to 573(000).
Skysports Action: June (13th-15th): For the period during June that we were on air the total UK Viewing Audience averaged 42.6 million of which average daily reach achieved by this channel was 227(000) and average weekly reach amounted to 1292(000).
Skysports Mix: June(13th-15th): For the period during June that we were on air the total UK Viewing Audience averaged 42.6 million of which average daily reach achieved by this channel was 188(000) and average weekly reach amounted to 1050(000).
Front Runner: June (21st June – 1st July): For the period during June that we were on air the total UK Viewing Audience averaged 42.6 million of which average daily reach achieved by this channel was 22(000) and average weekly reach amounted to 50.1(000).
Motors TV: June(7th-12th): For the period during June that we were on air the total UK Viewing Audience averaged 42.6 million of which average daily reach achieved by this channel was 33(000) and average weekly reach amounted to 170(000). (Average weekly total: 3.13 million)
Programme 3 - Snetterton
Skysports Arena:
July(18th-20th): For the period during July that we were on air the total UK Viewing Audience averaged 41.5 million of which average daily reach achieved by this channel was 181(000) and average weekly reach amounted to 867(000).
Skysports Action: July(18th-20th): For the period during July that we were on air the total UK Viewing Audience averaged 41.5 million of which average daily reach achieved by this channel was 136(000) and average weekly reach amounted to 646(000).
Skysports Mix: July(18th-20th): For the period during July that we were on air the total UK Viewing Audience averaged 41.5 million of which average daily reach achieved by this channel was 230(000) and average weekly reach amounted to 1277(000).
Front Runner: July (7th-10th): For the period during July that we were on air the total UK Viewing Audience averaged 42.6 million of which average daily reach achieved by this channel was 33(000) and average weekly reach amounted to 89.5(000).
Motors TV: July(10th-13th): For the period during July that we were on air the total UK Viewing Audience averaged 42.6 million of which average daily reach achieved by this channel was 23(000) and average weekly reach amounted to 140(000). (Average weekly total: 3.01 million)
Programme 4 - Zandvoort
Skysports Arena: Aug (29th- Sept 7th): For the period during August-September that we were on air the total UK Viewing Audience averaged 41.5 million of which average daily reach achieved by this channel was 121(000) and average weekly reach amounted to 602(000).
Skysports Action: Aug (29th- Sept 7th): For the period during August-September that we were on air the total UK Viewing Audience averaged 41.5 million of which average daily reach achieved by this channel was 180(000) and average weekly reach amounted to 917(000).
Skysports Mix: Aug (29th- Sept 7th): For the period during August-September that we were on air the total UK Viewing Audience averaged 41.5 million of which average daily reach achieved by this channel was 194(000) and average weekly reach amounted to 1107(000).
Front Runner: Aug (23rd-29th): For the period during August that we were on air the total UK Viewing Audience averaged 40.9 million of which average daily reach achieved by this channel was 36.6(000) and average weekly reach amounted to 104.6(000).
Motors TV: Aug(16th-20th): No figures published (Average weekly total: 2.73 million)
Programme 5 - Silverstone
Front Runner: Sept (27th-29th): For the period during September that we were on air the total UK Viewing Audience averaged 42.2 million of which average daily reach achieved by this channel was 37.5(000) and average weekly reach amounted to 93.5(000).
Motors TV: Aug(11th-15th): No figures published.
Skysports Arena: Oct(3rd-5th): For the period during October that we were on air the total UK Viewing Audience averaged 43.4 million of which average daily reach achieved by this channel was 203(000) and average weekly reach amounted to 985(000).
Skysports Action: Oct(3rd-5th): For the period during October that we were on air the total UK Viewing Audience averaged 43.4 million of which average daily reach achieved by this channel was 345(000) and average weekly reach amounted to 1266(000).
Skysports Mix: Oct(3rd-5th): For the period during October that we were on air the total UK Viewing Audience averaged 43.4 million of which average daily reach achieved by this channel was 241(000) and average weekly reach amounted to 1374(000). (Average weekly total: 3.71 million)
Programme 6 – Brands Hatch
Front Runner: Oct (1st-9th): For the period during October that we were on air the total UK Viewing Audience averaged 43.8 million of which average daily reach achieved by this channel was 40.5(000) and average weekly reach amounted to 140(000).
Motors TV: Oct: No figures published.
Skysports Arena: Oct 31st- Nov 2nd: For the period during October / November that we were on air the total UK Viewing Audience averaged 43.8 million of which average daily reach achieved by this channel was 154(000) and average weekly reach amounted to 762(000).
Skysports Action: Oct 31st- Nov 2nd: For the period during October / November that we were on air the total UK Viewing Audience averaged 43.8 million of which average daily reach achieved by this channel was 206(000) and average weekly reach amounted to 1063(000).
Skysports Mix: Oct 31st- Nov 2nd: For the period during October / November that we were on air the total UK Viewing Audience averaged 43.8 million of which average daily reach achieved by this channel was 197(000) and average weekly reach amounted to 1152(000). (Average weekly total: 3.11 million)
Programme 7 – Donington Park
Front Runner: Nov 24th-28th: For the period during November that we were on air the total UK Viewing Audience averaged 44.2 million of which average daily reach achieved by this channel was 40 (000) and average weekly reach amounted to 127 (000).
Skysports Arena: Dec 5th-14th: For the period during December that we were on air the total UK Viewing Audience averaged 44.1 million of which average daily reach achieved by this channel was 246 (000) and average weekly reach amounted to1068 (000).
Skysports Action: Dec 5th-14th: For the period during December that we were on air the total UK Viewing Audience averaged 44.1 million of which average daily reach achieved by this channel was 178 (000) and average weekly reach amounted to 889 (000).
Skysports Mix: Dec 5th-14th: For the period during December that we were on air the total UK Viewing Audience averaged 44.1 million of which average daily reach achieved by this channel was 219 (000) and average weekly reach amounted to 1232 (000). (Average weekly total: 3.31 million)
Motor Trend on Demand: Audience data is not released for this online channel but as reported in the following summary we have established that since launch last year they have already signed up over 200,000 subscribers.
Total average weekly audience: 22.15 million viewers
COMPARISONS:
BTCC: Last years BTTC coverage was broadcast on ITV4 and comprised of 7 hours coverage of each round (10) plus a further 3 hours of highlights per round again broadcast on ITV4. In total the series received 100 hours over coverage. However, of this total some 30 hours were transmitted between 11.45 pm and 07.30! Further published figures show that of the remaining 70 hours the peak audience reached 500,000 whilst the audience for the opening round saw only 189,000 watch Race One, 301,000 watch Race Two and 260,000 watch race Three. (source: The F1 Broadcasting Blog)
Formula One World Championship: Clearly no comparison can be drawn coverage wise between the Funcup Championship and F1 but it’s interesting to record that overall audiences for the worlds premier motorsport series fell by 4%! (source F1 Media)
UK Formula 3 Championship: Coverage of all 24 races was provided by ITV4 with a onehour slot broadcast during a Sunday evenings peak-time. No audience data is currently available but at its best one can assume that figures are going to be well below that of their BTCC audience viewing performance.
IMPORTANT NOTE: With the demise of Motorsport TV as a free to air broadcaster numerous other motorsport series and championships no longer enjoy any regular TV coverage.
Summary
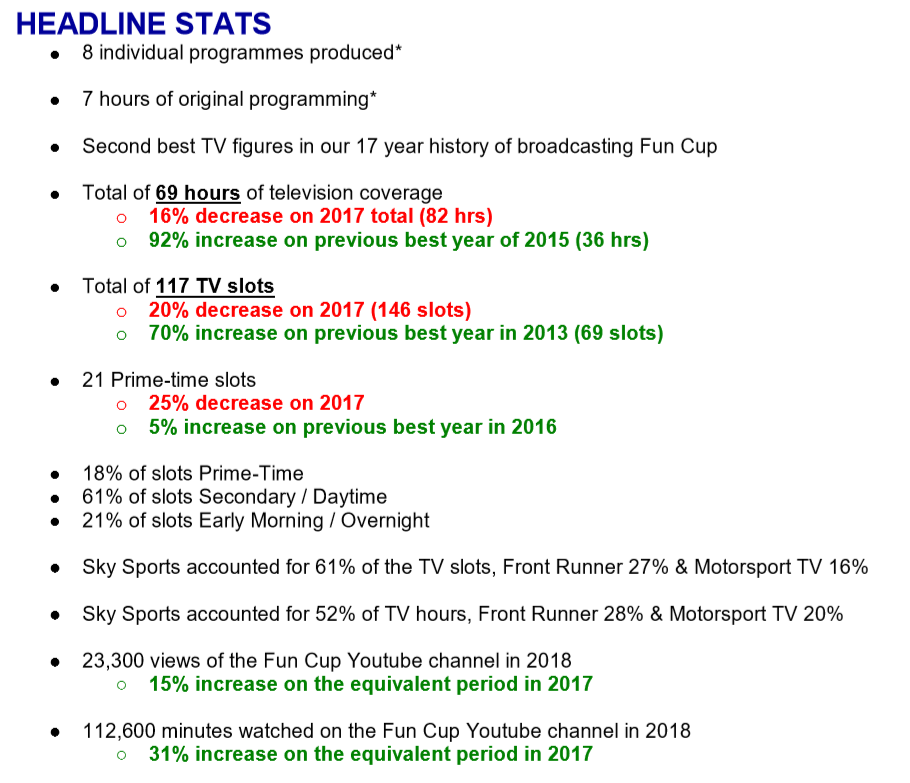
The Headline Stats on Page 9 clearly demonstrate how good coverage has been. Whilst the overall number of hours transmitted might be down on 2017, the overall trend is still massively up on previous years, as is the number of slots gained and the ratio of Prime-Time and Secondary airtime. For example, programme slots and broadcast hours achieved in 2018 are more than double what was achieved in 2016. It’s also pleasing to report that Front Runner has continued to deliver great audiences, an extra platform on Freesat and quality airtime slots as they became our second most important broadcaster.
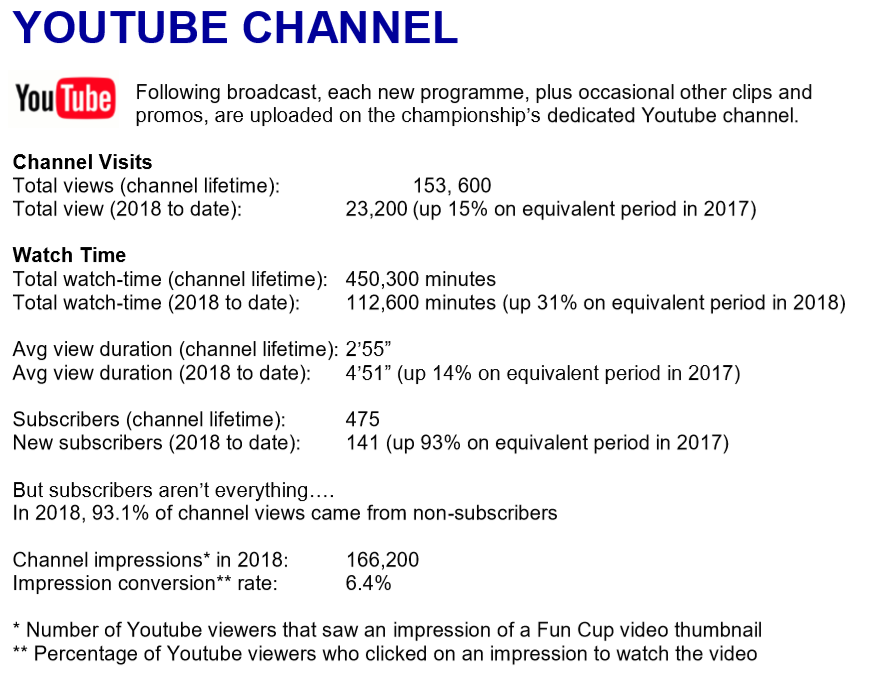
The Youtube channel has also performed well with a total of some 23,000 plus views throughout the season – a 15% increase over the previous year so far.
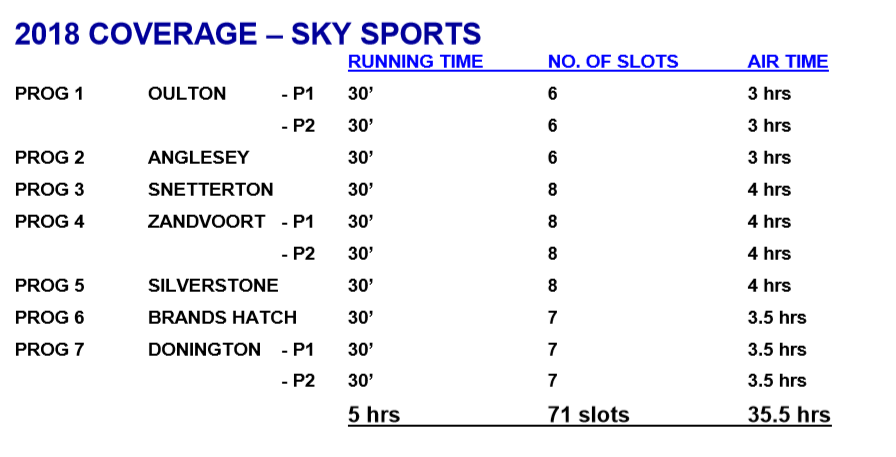
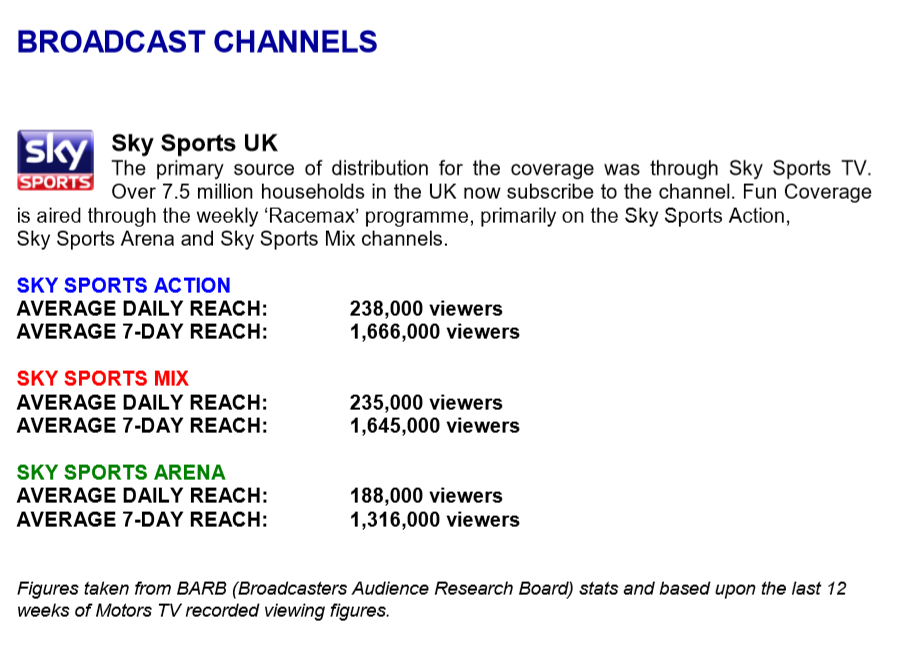
Importantly for the Funcup is that Sky Sports is easily the best performer in terms of reach and accounts for more than half of our slots and TV hours. Whilst this national coverage is vital, we should not forget that our motorsport coverage on this channel is almost unique. The broadcaster continues to recognise the valuable contribution that our programme Racemax makes which is a position that very few other national championships benefit from.
The 2018 Season Review (which airs late January) is of course not included which therefore allows us to make a fair year-on-year comparison by also excluding the Season Review figures from the previous years. In order to create a better comparison of how coverage of the Funcup has grown we have included a five-year comparison on number of slots and hours of TV and included some headline stats on how much higher than the previous bests (excluding 2017) these figures are set out below.
YEAR-BY-YEAR COMPARISON
2013 2014 2015 2016 2017* 2018* TV Slots 69 66 67 54 146 117
TV Hours 34.5 33 36 28.5 82 69
Prime Slots 16 18 17 20 28 21
*Excluding End of Season Review Shows - figures not yet available for the two-hour 2018 Season Review show, which airs in late January 2019.
In conclusion we like to take this opportunity in thanking the championship’s promotors, the organising clubs, the race teams and drivers for their considerable cooperation and assistance throughout this past season without which we could not have produced these excellent results.
In over 17 years of producing televised coverage of the Funcup the championship has never failed to provide consistently exciting racing and dramatic action that has enabled us to produce some of the UK’s best televised motorsport coverage.
● There is no other televised motorsport coverage that compares to that offered by The Funcup Championship
* Including Two-hour Season Review programme, which airs late January 2019
* Including Two-hour Season Review programme, which airs late January 2019
| fun_cup_summary_of_2018_tv_coverage_v4_key_facts.pdf | |
| File Size: | 408 kb |
| File Type: | |


